
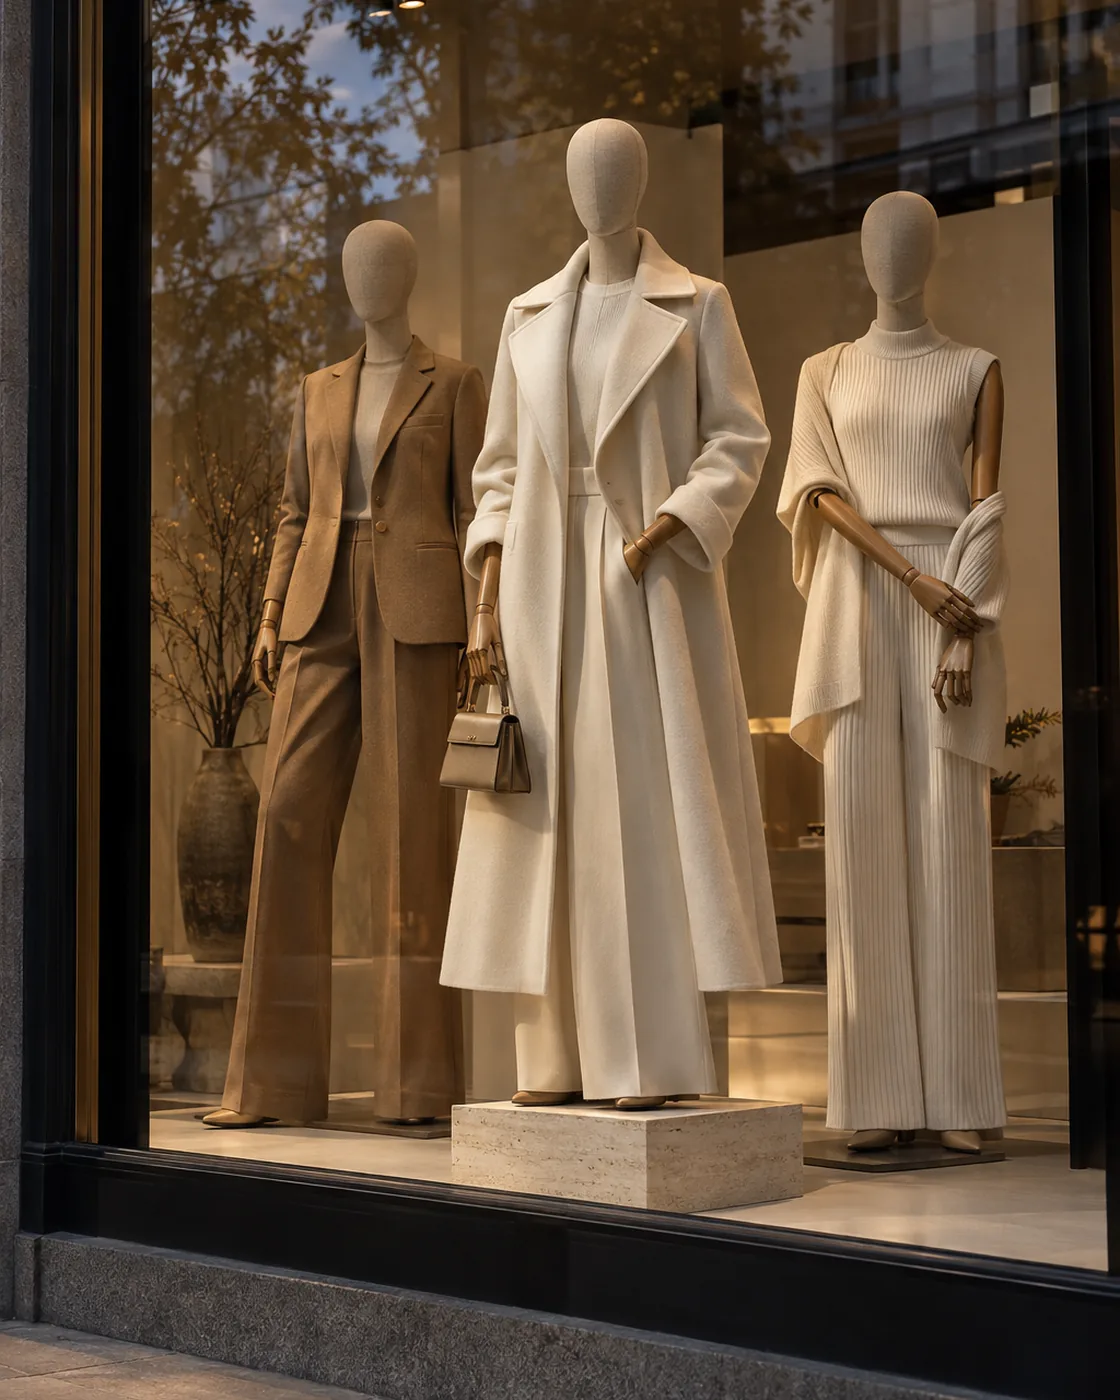
How to Measure Window Display Performance: A Retail Test Plan
Measure window display performance with clear stop, entry and purchase rates, matched comparison periods and a practical retail test log.
Measure window display performance by choosing one objective, counting the relevant shopper actions over matched observation periods and comparing rates with a clearly defined baseline. A display that attracts more stops is not necessarily driving more store entries or product purchases. Track the step that matches the campaign’s purpose.
This guide is for visual merchandising teams that want to evaluate a window change without assuming that every sales movement was caused by the display. It provides practical definitions, a worked example and a test log. The examples are hypothetical, not results from a XINTU client campaign.
Choose one primary objective before the window changes
Specify the outcome in a sentence: for example, increase the proportion of passing shoppers who enter, improve attention to a new collection, or generate inquiries about a featured look. Choose one primary measure and treat the others as supporting evidence.
For an attention campaign, stopping may be the most direct observable action. For a commercial launch, entry rate or featured-product inquiries may be more useful. Purchases require inventory and point-of-sale information as well as window observations.
Define the counts so different staff record the same thing
| Measure | Suggested calculation | Main limitation |
|---|---|---|
| Stop rate | Qualifying stops / observed passers-by x 100 | A stop indicates attention, not purchase intent |
| Observed entry rate | Entrants observed from that passing stream / observed passers-by x 100 | Other entrances or untracked routes can distort the count |
| Featured-product inquiry rate | Logged inquiries about the featured product / store entrants x 100 | Staff logging must be consistent |
| Store purchase conversion | Purchasing visitor parties / comparable entering visitor parties x 100 | Cannot isolate the window from the rest of the store |
| Featured-product units | Units sold in the defined observation period | Price, stock and promotions strongly affect the result |
Choose a consistent counting unit: individuals or shopping parties. Do not divide transactions by individual entrants and label the result as customer conversion without explaining the mismatch. Where purchasing parties cannot be tracked, report transactions per entrant as a separate operational measure.
Define a qualifying stop before collecting data, such as a visible pause facing the window for at least three seconds. This is a suggested working definition, not an industry standard. Apply the same rule to both versions and record which pavement zone is included.
Turn a design change into a testable hypothesis
A useful hypothesis links one change to one expected action: moving the focal mannequin closer to the main approach should improve the observed stop rate. Keep garments, pricing, campaign signs and other window elements constant where feasible. Changing every element at once only tests the package as a whole.
If the problem is unclear hierarchy, review how to create a focal point in a window. If reflections hide the product, use the retail display lighting guide to develop the alternative. The design guides explain what to change; the test plan establishes how to assess it.
Compare equivalent observation periods
A Saturday afternoon should not be compared directly with a quiet weekday morning. Use the same weekdays and time slots where possible, and note holidays, weather, nearby events, opening hours and promotional activity. Collect several matched blocks rather than relying on one busy hour.
With two comparable stores, you can keep one window unchanged and test the other, then exchange the versions if operationally practical. With one store, alternate planned display versions across comparable periods where installation effort allows it. Neither approach automatically eliminates location effects, seasonality or differences in shopper mix.
Set the observation schedule and decision rule before looking at results. If traffic is low or the versions differ only slightly, gather more evidence or record the outcome as inconclusive. A before-and-after comparison is useful operational evidence, but it does not by itself establish causation.
A worked example: attention improves, entry does not
Suppose version A has 1,000 observed passers-by, 80 qualifying stops and 40 observed entrants. Version B has 1,200 passers-by, 120 stops and 48 entrants, counted with the same rules during matched periods.
| Metric | Version A | Version B |
|---|---|---|
| Stop rate | 80 / 1,000 = 8% | 120 / 1,200 = 10% |
| Observed entry rate | 40 / 1,000 = 4% | 48 / 1,200 = 4% |
The stop rate rises by two percentage points, or 25% relative to the original rate. The observed entry rate stays at 4%. Raw entries increase because the passing traffic is higher; these numbers do not demonstrate improved entry efficiency. They also do not establish statistical significance.
If attention was the objective, B is worth further testing. If store entry was the objective, investigate whether the product story connects to a clear reason to enter. Record uncertainty instead of presenting a universal conversion claim.
Use a compact observation log
- Display version: date installed, layout photograph, garment references and the single change being tested.
- Observation block: date, start and end time, counting zone and observer.
- Counts: passers-by, qualifying stops, observed entrants and the agreed counting unit.
- Context: weather, glare, queueing, promotions, local events and staffing changes.
- Availability: featured-product stock and size availability during the block.
- Decision: retain, revise, repeat or inconclusive, with the reason.
Manual, aggregate counts can answer a basic window question without identifying shoppers. If you use cameras or third-party analytics, work through your organization’s approved privacy and data-handling process.
Turn the result into a repeatable display decision
Keep successful layouts with photographs, lighting positions and form references so another store can reproduce them. Repeat the test when the collection, street conditions or shopper profile changes. A winning arrangement for outerwear may not help accessories.
For repeatable mannequin positioning, see our grouping and composition guide. For a window brief built around your collection, read the window display mannequin guide.
Frequently asked questions
What is a good window display stop rate?
There is no useful universal target without a shared counting method and comparable location. Establish your baseline and compare matched periods using the same definitions.
How long should a window display test run?
Long enough to cover representative matched observation blocks and collect usable counts. A fixed number of days cannot guarantee reliable results at every traffic level.
Can higher sales prove that the window worked?
No. Sales can change because of stock, prices, promotions or traffic. A comparison that controls those factors provides stronger evidence, but still needs careful interpretation.
Do stores need camera analytics to test a display?
No. Consistent manual counts can support a small operational test. More complex tools only help when their definitions and coverage fit the question.
Plan the display and the measurement together
Send XINTU your window dimensions, viewing direction, featured garments and campaign objective through our contact page. A clear brief helps identify the mannequin formats and configurations you can trial, while your store observations establish whether the finished display meets its goal.